京橋のバイオインフォマティシャンの日常

南国のビーチパラソルの下で、Rプログラムを打ってる日常を求めて、、Daily Life of Bioinformatician in Kyobashi of Osaka

R環境で小説のテキストマイニングをやってみたら、○○○な結末になった件【その1: 夏目漱石の小説「坊っちゃん」を使った、テキストの前処理編】

はじめに

テキストマイニングは、簡単に言うと、テキストデータを定量的に扱って、有益な情報を抽出するデータマイニング手法の1つです。 このようなテキストの情報解析では、自然言語処理、形態素解析、キーワード抽出、共起分析、ネットワーク可視化、機械学習、感情分析など、様々な分析手法が用いられます。 近年では各種のAPIやWebスクレイピングなどを利用して、ウェブやSNS、地図上のクチコミからテキストデータを取得して、テキストマイニングに活用されています。 『R環境で小説のテキストマイニング』の連載シリーズでは、テキストマイニングの活用事例として、小説テキストを対するテキストマイニングの基本的な手法を概説しています。 各分析手法は、フリーソフトであるR言語やPythonのパッケージを主に用いて実施しています。

そもそも、自分が小説とかを通読するのが苦手ということもあって、 テキストマイニングの観点からせめて、 「マイニング結果から小説を読んだ気になれる」とか、「全体のあらずじとか、盛り上がっている章とかがまぁまぁ分かる」といった辺りのことができるかどうかを以前から調査したかった経緯があります。 そのため、テキストマイニング、形態素解析、ネットワーク可視化や感情分析による文脈解釈とかを扱う連載記事を書くことにしました。

他方、そもそもの小説を読む醍醐味とかは完全に無くなりますけどね。。。

テキストマイニングの対象小説は、夏目漱石の「坊っちゃん」にしました。 理由は後ほど説明します。それでは、テキストマイニングの世界に行ってらっしゃい。

連載シリーズの目次

1. 青空文庫、対象小説の紹介
2. 「坊っちゃん」のテキストの前処理
3. 形態素解析と辞書設定
4. 形態素解析と複合語抽出 (ルールベース抽出、pytermextract)
5. テキストマイニングと形態素のワードクラウド
6. テキストマイニングとN-gramのネットワーク表現(章ごとの関係性とか)
7. テキストマイニングと単語の埋め込み生成(word2vecとか)
8. 文章の感情分析(感情ポジネガ分析とか、英語感情対応表とか、ML-askとか)
9. ミクロとマクロなテキスト解析〜応用篇として内容を考え中〜


【その1: 夏目漱石の小説「坊っちゃん」を使った、テキストの前処理編】に関する内容をやっていきます。

実行環境

#ターミナル上のR環境
R version 4.1.2 (2021-11-01) -- "Bird Hippie"
Copyright (C) 2021 The R Foundation for Statistical Computing
Platform: aarch64-apple-darwin20.6.0 (64-bit)

#RStudioターミナル上のR環境
R version 4.1.2 (2021-11-01) -- "Bird Hippie"
Copyright (C) 2021 The R Foundation for Statistical Computing
Platform: x86_64-apple-darwin17.0 (64-bit)

今回、M1 MacだとRStudioでRMeCabパッケージがうまく動作せず、 やや面倒ですが、形態素解析の部分はターミナルからRを起動して実行しています。

1. 青空文庫、対象小説の紹介

夏目 漱石が執筆した小説の無料公開リスト

実は、夏目 漱石の小説本文は、ウェブ上で無料公開されています

著作権切れ作品を集めた、青空文庫というサイトにアップされています。

www.aozora.gr.jp

例えば、「坊っちゃん」とかもhtml形式のテキストで公開されていて読むことができます。

www.aozora.gr.jp

「坊っちゃん」のテキスト部分をWebスクレイピングで取得すると、 R環境上でテキストを利用できます。

次のセクションでは、Webスクレイピングによるテキストの取得から、テキスト情報の前処理を扱います。

2. 「坊っちゃん」のテキストの前処理

上画像の「坊っちゃん」のテキスト部分をWebスクレイピングで取得します。ご丁寧に漢字にルビがふってあるので、それらを前処理で除去していきます

また、テキスト部分のXpathは「/html/body/div[3]"」になります。

それでは、R環境を立ち上げて以下を実行して、テキストをざっくり取得します。

#パッケージのインストール
install.packages(c("rvest", "magrittr", "stringr"))
#ロード
library(rvest); library(magrittr); library(stringr)

##テキストのWebスクレイピング
#「坊っちゃん」のURL
Bochan_url <- "https://www.aozora.gr.jp/cards/000148/files/752_14964.html"

#ウェブサイトを確認するなら
#browseURL(Bochan_url)

#テキストの取得
Bochan_text <- Bochan_url %>%
  rvest::read_html() %>%
  rvest::html_nodes(xpath = "/html/body/div[3]") %>%
  rvest::html_text()

#取得結果の表示
str(Bochan_text)
#chr "一\r\n\r\n 親譲(おやゆず)りの無鉄砲(むてっぽう)で小供の時から損ばかりしている。小学#校に居る時分学校の二階"| __truncated__

テキストを取得すると、 「\r\n\r\n」「\r\n」とかの改行記号があったり、 ルビ部分があったりします。 組み込み関数やstringrパッケージを使って、それらを除いていきます。

#テキストを章ごとに分割する
#\r\n\r\n
#\\p{Han}は「漢字」指定、. は「任意文字」指定
Bochan_text.sp <- stringr::str_split(Bochan_text, 
                                     pattern = "\\p{Han}\r\n\r\n.|\\p{Han}\\p{Han}\r\n\r\n.")[[1]][-1]

#改行「\r\n」を消す
Bochan_text.sp.rn <- gsub(pattern="\r\n |\r\n", 
                          replacement="",
                          Bochan_text.sp)  

#ルビ部分を削除する
Rub <- c(".", "..", "...", "....", ".....", "......", ".......", "........", ".........", "..........", "................", ".................")

#ルビの任意文字数
nchar(Rub)
#[1]  1  2  3  4  5  6  7  8  9 10 16 17

#実行
for(n in Rub){
Bochan_text.sp.rn <- gsub(pattern=paste0("[(]", n, "[)]"), 
                        replacement="",
                        Bochan_text.sp.rn)  
}

#文字数
nchar(Bochan_text.sp.rn)
#[1]  7499  5983  5821  7583  7495 10412 10071  7133  8409  8058  9806

#先頭20文字のテキストの表示
stringr::str_sub(Bochan_text.sp.rn[1], start = 1, end = 20) 
#[1] "親譲りの無鉄砲で小供の時から損ばかりして"
stringr::str_sub(Bochan_text.sp.rn[2], start = 1, end = 20) 
#[1] "ぶうと云って汽船がとまると、艀が岸を離れ"
stringr::str_sub(Bochan_text.sp.rn[3], start = 1, end = 20) 
#[1] "いよいよ学校へ出た。初めて教場へはいって"

こんな感じで、章ごとにテキストを分けた、11要素のベクトル空間ができます。

次に、テキストファイルとして書き出して、GitHubにアップします。

#テキストファイルへの書き出し
#全文
write(Bochan_text.sp.rn, file = "Bochan_text.all.txt", append = F)
#saveRDS(Bochan_text.sp.rn, file = "Bochan_text.all.Rds")

#第1章
write(Bochan_text.sp.rn[1], file = "Bochan_text.1st.txt", append = F)
#saveRDS(Bochan_text.sp.rn[1], file = "Bochan_text.1st.Rds")

#第2章
write(Bochan_text.sp.rn[2], file = "Bochan_text.2nd.txt", append = F)
#saveRDS(Bochan_text.sp.rn[2], file = "Bochan_text.2nd.Rds")

坊ちゃんの第1章のテキスト

坊ちゃんの第2章のテキスト

処理したテキストの保存

次に、先ほど処理したテキストをGitHubからダウンロードする方法をのせています。

##GitHubにアップロードしたファイルたち
#テキスト全文
file_path_all <- "https://raw.githubusercontent.com/kumeS/Blog/master/R_text_analysis/R_01/Bochan_text.all.txt"
browseURL(file_path_all)
Bochan_text.all <- readLines(con = file(file_path_all))

#テキスト全文: Rds version
Rds_path_all <- "https://github.com/kumeS/Blog/raw/master/R_text_analysis/R_01/Bochan_text.all.Rds"
download.file(url=Rds_path_all, destfile = basename(Rds_path_all))
Bochan_text.all <- readRDS(basename(Rds_path_all))


##第1章
file_path_1st <- "https://raw.githubusercontent.com/kumeS/Blog/master/R_text_analysis/R_01/Bochan_text.1st.txt"
browseURL(file_path_1st)
Bochan_text.1st <- readLines(con = file(file_path_1st))

#第1章: Rds version
Rds_path_1st <- "https://github.com/kumeS/Blog/raw/master/R_text_analysis/R_01/Bochan_text.1st.Rds"
download.file(url=Rds_path_1st, destfile = basename(Rds_path_1st))
Bochan_text.all <- readRDS(basename(Rds_path_1st))


##第2章
file_path_2nd <- "https://raw.githubusercontent.com/kumeS/Blog/master/R_text_analysis/R_01/Bochan_text.2nd.txt"
browseURL(file_path_2nd)
Bochan_text.2nd <- readLines(con = file(file_path_2nd))

#第2章: Rds version
Rds_path_2nd <- "https://github.com/kumeS/Blog/raw/master/R_text_analysis/R_01/Bochan_text.2nd.Rds"
download.file(url=Rds_path_2nd, destfile = basename(Rds_path_2nd))
Bochan_text.all <- readRDS(basename(Rds_path_2nd))

まとめ

Html形式のテキストを取得して、ざっくりとテキストの前処理までをやってみました。

次回からは、形態素解析も取り入れて、テキスト解析を行います。

テキスト処理の関連記事

skume.net

skume.net

skume.net

skume.net

skume.net

skume.net

参考資料

skume.net

skume.net

skume.net

M1 Mac環境で、flash2を使ってペアエンドfastqをマージしてみた件

はじめに

この記事では、flash2を使った、ペアエンドリード(paired-end read)のマージ(read merge)、オーバーラップ(read overlap)とその他諸設定について紹介します。 flash2のもともとのアルゴリズムは、「FLASH (Fast Length Adjustment of SHort reads) 」と言われるものです。 名前からも推測できる通り、flash2は、FLASHの改良版となります。

github.com

FLASH は、リードの長さが2倍より短いDNA断片から生成されたペアエンドリードを、 正確かつ高速に、ペアエンドリードをマージする(リード同士を結合する)ためのツールの1つです。 マージされたリードペアは長いリードとして、リード数のカウントをしたり、 ゲノムアセンブリやゲノム解析のプロセスで活用されたりします。

このFLASHアルゴリズムでは、リードペア間の最小長以上のオーバーラップをすべて考慮し、ミスマッチ密度(オーバーラップ領域内のミスマッチ塩基の割合)が最も低くなるオーバーラップを選択しています。また、ミスマッチ部位の品質スコアも考慮しています。 マージされた配列を構築する際に、FLASHはオーバーラップした領域のコンセンサス配列を計算しています。

一方で、flash2の実行には、いくつかの制限があります。 当然ながら、オーバーラップしていないペアエンドリードのマージには使えません。 また、ペアエンドのfastqデータに適していて、サンガーシーケンスのデータには基本的に適していません。

FLASHの原著論文


Title: FLASH: fast length adjustment of short reads to improve genome assemblies
Authors: Tanja Magoč and Steven L. Salzberg

詳しくは、原著論文を確認してみてください。

bioinformatics.oxfordjournals.org

今回のzsh実行環境

macOS Big Sur (バージョン11.5.2)
MacBook Air (M1, 2020)
チップ Apple M1
メモリ 16GB

M1 Macにおけるflash2のインストール

flash2は、GitHubからクローンして、ソースからコンパイルします。 コンパイルといっても、「ダウンロードとmake実行」でインストールが完了します。

おそらく最近のMacでも、ダウンロードには事前にgitコマンドを設定する必要があります。

gitコマンドの設定方法や使い方は、過去記事を参考のこと。

skume.net

ターミナル(zsh)を起動して、以下のコマンドを実行していきます。

#ダウンロード
git clone https://github.com/dstreett/FLASH2.git

#ディレクトリ移動
cd FLASH2

#コンパイル
make

#パス設定の前段階: 手っ取り早く"/opt/homebrew/bin"に置いておく
cd ../
mv FLASH2 /opt/homebrew/bin

#HOMEに移動
#cd ~/

#パスを.zshrcを書き込む
echo 'export PATH="/opt/homebrew/bin/FLASH2:$PATH"' >> .zshrc

#いったんソースする
source .zshrc
 
#パス設定
which flash2
#/opt/homebrew/bin/FLASH2/flash2

#ヘルプで動作確認: 出力表示は補足に記載
flash2 -h

flash2によるペアエンドfastqのマージ実行

flash2の実行には、ペアエンドのfastqファイル(2つのfastq)が入力ファイルとして必要です。

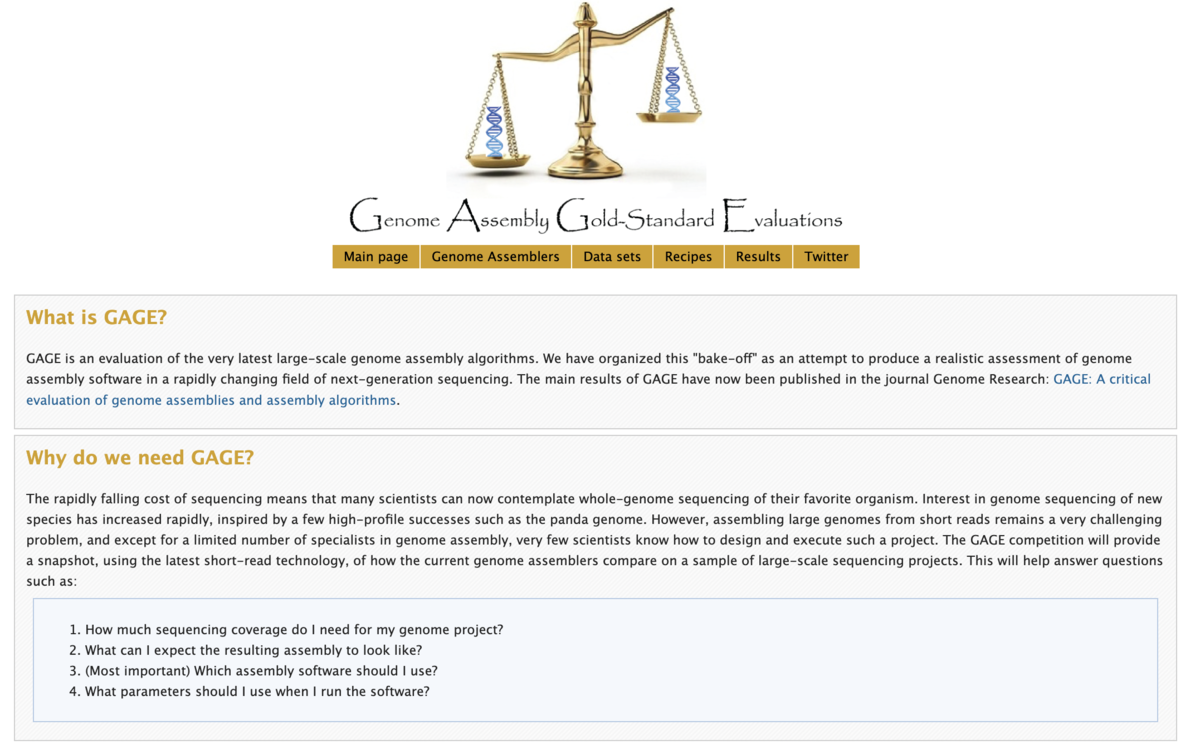
GAGE (Genome Assembly Gold-standard Evaluation) というサイトがあって、 fastqのテストデータを色々と用意してくれているので、今回、それをテスト用のデータとして使うことにします。


gage.cbcb.umd.edu

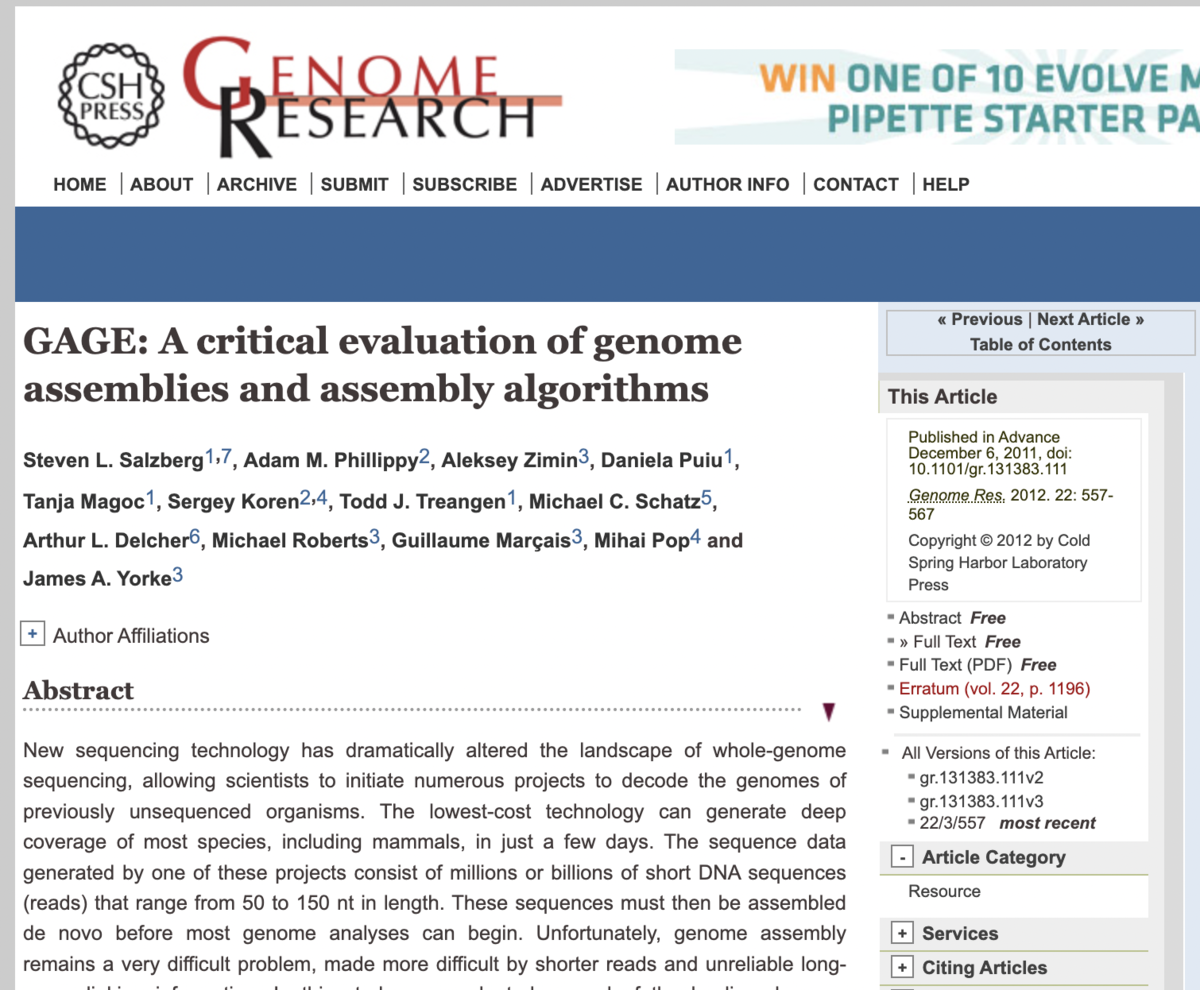
詳しくは、GAGEの原著論文もあります。

genome.cshlp.org

GAGEからペアエンドのfastqデータを取得する

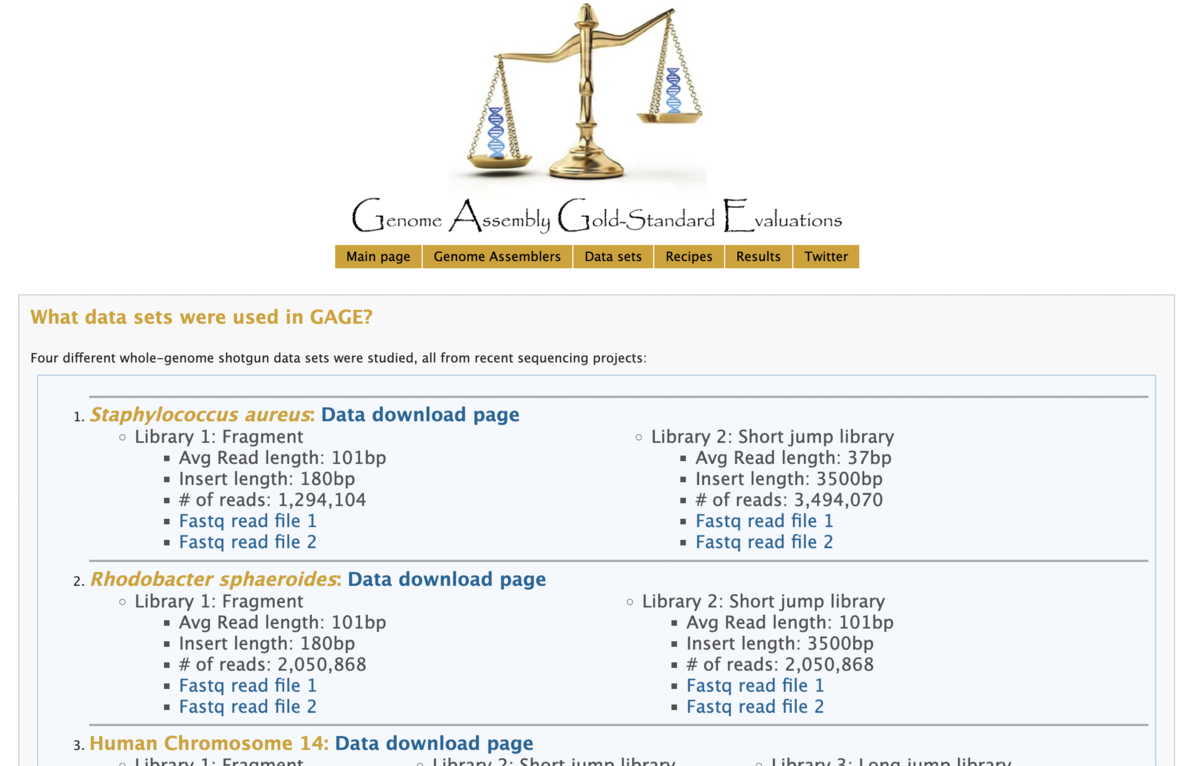
今回、GAGEから1. Staphylococcus aureus (黄色ブドウ球菌)のシーケンスデータをダウンロードします。

簡単なサンプル情報は下記に示します。

# テストデータ
# Staphylococcus aureus: Data download page
# Library 1: Fragment
# Avg Read length: 101bp
# Insert length: 180bp
# # of reads: 1,294,104

まずは、Read1とRead2のFastqファイルをそれぞれwgetでダウンロードして、gzipで解凍します。

#ダウンロード
wget http://gage.cbcb.umd.edu/data/Staphylococcus_aureus/Data.original/frag_1.fastq.gz http://gage.cbcb.umd.edu/data/Staphylococcus_aureus/Data.original/frag_2.fastq.gz

#解凍
gzip -d -k frag_1.fastq.gz
gzip -d -k frag_2.fastq.gz

#ファイルの詳細表示
ls -lh
#-rw-r--r--  1 sas  staff   140M  4 15  2011 frag_1.fastq
#-rw-r--r--  1 sas  staff    61M  4 15  2011 frag_1.fastq.gz
#-rw-r--r--  1 sas  staff   140M  4 15  2011 frag_2.fastq
#-rw-r--r--  1 sas  staff    65M  4 15  2011 frag_2.fastq.gz

データは、fastq.gz形式で約60Mバイト、生データで約150MBバイトという、 低スペックPCにも優しい低容量です。

次に、実際に、flash2コマンドを使って、リードのマージを行います。 入力は、2つのfastqファイルを使います。 -tオプションでは、worker threadsの数を指定します。

#実行
flash2 frag_1.fastq frag_2.fastq -t 2

#[FLASH] Starting FLASH v2.2.00
#[FLASH] Fast Length Adjustment of SHort reads
#[FLASH]  
#[FLASH] Input files:
#[FLASH]     frag_1.fastq
#[FLASH]     frag_2.fastq
#[FLASH]  
#[FLASH] Output files:
#[FLASH]     ./out.extendedFrags.fastq
#[FLASH]     ./out.notCombined_1.fastq
#[FLASH]     ./out.notCombined_2.fastq
#[FLASH]     ./out.hist
#[FLASH]     ./out.histogram
#[FLASH]  
#[FLASH] Parameters:
#[FLASH]     Min overlap:           10
#[FLASH]     Min overlap outie:     35
#[FLASH]     Max overlap:           65
#[FLASH]     Max mismatch density:  0.250000
#[FLASH]     Allow "outie" pairs:   true
#[FLASH]     Cap mismatch quals:    false
#[FLASH]     Combiner threads:      2
#[FLASH]     Input format:          FASTQ, phred_offset=33
#[FLASH]     Output format:         FASTQ, phred_offset=33
#[FLASH]  
#[FLASH] Starting reader and writer threads
#[FLASH] Starting 2 combiner threads
#[FLASH] Processed 25000 read pairs
#[FLASH] Processed 50000 read pairs
#[FLASH] Processed 75000 read pairs
#[FLASH] Processed 100000 read pairs
#[FLASH] Processed 125000 read pairs
#[FLASH] Processed 150000 read pairs
#[FLASH] Processed 175000 read pairs
#[FLASH] Processed 200000 read pairs
#[FLASH] Processed 225000 read pairs
#[FLASH] Processed 250000 read pairs
#[FLASH] Processed 275000 read pairs
#[FLASH] Processed 300000 read pairs
#[FLASH] Processed 325000 read pairs
#[FLASH] Processed 350000 read pairs
#[FLASH] Processed 375000 read pairs
#[FLASH] Processed 400000 read pairs
#[FLASH] Processed 425000 read pairs
#[FLASH] Processed 450000 read pairs
#[FLASH] Processed 475000 read pairs
#[FLASH] Processed 500000 read pairs
#[FLASH] Processed 525000 read pairs
#[FLASH] Processed 550000 read pairs
#[FLASH] Processed 575000 read pairs
#[FLASH] Processed 600000 read pairs
#[FLASH] Processed 625000 read pairs
#[FLASH] Processed 647052 read pairs
#[FLASH]  
#[FLASH] Read combination statistics:
#[FLASH]     Total pairs:       647052
#[FLASH]     Discarded pairs:   262
#[FLASH]     Percent Discarded: 0.04%
#[FLASH]     Combined pairs:    370303
#[FLASH]         Innie pairs:   369148 (99.69% of combined)
#[FLASH]         Outie pairs:   1155 (0.31% of combined)
#[FLASH]     Uncombined pairs:  276487
#[FLASH]     Percent combined:  57.25%
#[FLASH]  
#[FLASH] Writing histogram files.
#[FLASH]  
#[FLASH] FLASH v2.2.00 complete!
#[FLASH] 11.136 seconds elapsed

解析が終って、出力結果(out.histogram)を出力表示すれば、テキストのヒストグラムとして結果を確認できます。 アスタリスクのヒストグラムは、なんとも乙な感じです。

#結果確認
#ヒストグラム確認
tail -n 90 out.histogram

#103   
#104   
#105   
#106   
#107   
#108   
#109   
#110   
#111   
#112   
#113   
#114   
#115   *
#116   *
#117   *
#118   *
#119   *
#120   *
#121   **
#122   **
#123   ***
#124   ***
#125   ****
#126   *****
#127   ******
#128   ********
#129   ********
#130   ***********
#131   ************
#132   **************
#133   *****************
#134   ********************
#135   **********************
#136   *************************
#137   *****************************
#138   *******************************
#139   ************************************
#140   *************************************
#141   ****************************************
#142   *********************************************
#143   ************************************************
#144   **************************************************
#145   ******************************************************
#146   ********************************************************
#147   ***********************************************************
#148   *************************************************************
#149   ***************************************************************
#150   ****************************************************************
#151   *****************************************************************
#152   *******************************************************************
#153   ********************************************************************
#154   **********************************************************************
#155   ********************************************************************
#156   ***********************************************************************
#157   **********************************************************************
#158   ***********************************************************************
#159   *********************************************************************
#160   ***********************************************************************
#161   **********************************************************************
#162   ************************************************************************
#163   ***********************************************************************
#164   *********************************************************************
#165   **********************************************************************
#166   ***********************************************************************
#167   *******************************************************************
#168   *******************************************************************
#169   ********************************************************************
#170   ******************************************************************
#171   *****************************************************************
#172   *****************************************************************
#173   ****************************************************************
#174   ****************************************************************
#175   *************************************************************
#176   *************************************************************
#177   **************************************************************
#178   **************************************************************
#179   **********************************************************
#180   **********************************************************
#181   **********************************************************
#182   *********************************************************
#183   ******************************************************
#184   ******************************************************
#185   *******************************************************
#186   ******************************************************
#187   **************************************************
#188   **************************************************
#189   ****************************************************
#190   ******************************************************
#191   **********************************************
#192   ***********************************************

また、マージされたリードが出力されたFastq(out.extendedFrags.fastq)や ヒストグラムの数値のテキスト出力ファイルであるout.histもあります。

マージされなかったリードは、 out.notCombined_1.fastq、out.notCombined_2.fastqとしてアウトプットされます。

#Extended FASTQ 確認
head out.extendedFrags.fastq
#@SRR022868.1483
#TCATACATATTAATATAGTCAGAACTAGTAATATAATTTTGGGCATTTCTATATAAATATCTATTCCATGACAGAAATACACATTGCGCTGGTCTTCCCATTTCTTTAAATAAATTTAAACGATTAATAATTGCTTTCTCT
#+
#IIIIIIIIIIIIIIIIIIIIIIIIIIIIIIIIIIIIIIIIGIBECEIF8E;DEAE7<I1ICD2ICB%8I1354I25;A9E=>52?AI6;795:%6BIACII;II@<IIIIIA<0AFI3FIIIIIIIIIIIIIIIIIIIIII
#@SRR022868.1630
#AATATGAAGCAATTTTTTCAAAAACGCTATTAGTCACAAAATGTAAACATAATTTTAACAAATGTGTGAACCCACGTCGCACCTTGATTTATCAACATTTTTGATACAATTTTATTAATTTTTTTCCCATAAGCCCT
#+
#IIIIIIIIIIIIFIIIII>IIIBFIIIIII1II/5I:I5@6EI24%81+<,&+A4436(3,3,+*A+00(*#0/62,/&;&2.10-/3202+F+-8;+8,>31;?-:5%584+$)G2I6I438C9IIII.I,6)IIB
#@SRR022868.1854
#TTCTGTGTATGAAAATATTTTTCATAAAAATTGTTTGAATCATGTAACAATCATATAAATTGCTGTTTATATTGTTGTGAAAATGAGTTGACAAAAGTCGGTATAGATATGTAGACATCCTATTTTTAGCGAG

#ヒストグラムのヘッド表示
head out.hist
#35    15
#36    12
#37    4
#38    11
#39    9
#40    7
#41    12
#42    10
#43    8
#44    11

まとめ

flash2を使って、ペアエンド・リードのマージをやってみました。 ソースからコンパイルすると、設定が少なくて助かります。 あと、M1 Macでもちゃんとコンパイルが通るもんなんですね。感心。

便利なバイオインフォのツールがたくさんありそうので、 引き続き、ツール発掘を続けてみます。

ゲノム解析の関連記事

skume.net

skume.net

skume.net

skume.net

skume.net

参考資料

kazumaxneo.hatenablog.com

https://ccb.jhu.edu/software/FLASH/ccb.jhu.edu

補足

FASTQ形式からFASTA形式への変換 - sedコマンドを使う方法

sedコマンドを使って、Fastqファイルから必要な行を選択的に出力することができます。 4行ごとに1行目と2行目を出力すれば、配列のヘッダーとFASTAフォーマットに必要な配列が得られます。

下記のような実行例になります。

sed -n '1~4s/^@/>/p;2~4p' INFILE.fastq > OUTFILE.fasta

bioinformaticsworkbook.org

FASTQ形式からFASTA形式への変換 - fastq_to_fastaを使う方法

fastq_to_fastaは、FASTX-toolkitで利用可能です。巨大なデータセットでもうまく対応できます。下記のような実行例になります。

fastq_to_fasta -n -i INFILE.fastq -o OUTFILE.fasta

hannonlab.cshl.edu

Anacondaの設定

結局使わなかったけども、、Anacondaの設定もメモしておきます

まずは、brewコマンドで、Anacondaをインストールします。

以下のbrew install --caskコマンドで入ります。

#インストール
brew install --cask anaconda
#...
#==> Downloading https://repo.anaconda.com/archive/Anaconda3-2022.05-MacOSX-arm64
#==> Installing Cask anaconda
#==> Running installer script 'Anaconda3-2022.05-MacOSX-arm64.sh'

#パス設定
echo 'export PATH="/opt/homebrew/anaconda3/bin:$PATH"' >> .zshrc
#tail -n 1 .zshrc
source .zshrc

#パス確認
echo $PATH

#condaパス確認
which conda
#/opt/homebrew/anaconda3/bin/conda

FLASH-1.2.11のインストール方法 from sourceforge.net

これは、FLASHのオリジナル版のインストール方法です。

ターミナルを起動して、以下のコマンドを実行していきます。

#ダウンロード
wget https://sourceforge.net/projects/flashpage/files/FLASH-1.2.11.tar.gz

#解凍
tar xzf FLASH-1.2.11.tar.gz

#ディレクトリ移動
cd FLASH-1.2.11

#コンパイル
make

#パス設定の前段階: 手っ取り早く"/opt/homebrew/bin"に置いておく
cd ../
mv FLASH-1.2.11 /opt/homebrew/bin

#HOMEに移動
cd ~/

#パスを.zshrcを書き込む
echo 'export PATH="/opt/homebrew/bin/FLASH-1.2.11:$PATH"' >> .zshrc

#いったんソースする
source .zshrc
 
#パス設定
which flash

#ヘルプで動作確認: 出力表示は補足に記載
flash -h

flash -h の出力

Usage: flash [OPTIONS] MATES_1.FASTQ MATES_2.FASTQ
       flash [OPTIONS] --interleaved-input (MATES.FASTQ | -)
       flash [OPTIONS] --tab-delimited-input (MATES.TAB | -)

----------------------------------------------------------------------------
                                 DESCRIPTION                                
----------------------------------------------------------------------------

FLASH (Fast Length Adjustment of SHort reads) is an accurate and fast tool
to merge paired-end reads that were generated from DNA fragments whose
lengths are shorter than twice the length of reads.  Merged read pairs result
in unpaired longer reads, which are generally more desired in genome
assembly and genome analysis processes.

Briefly, the FLASH algorithm considers all possible overlaps at or above a
minimum length between the reads in a pair and chooses the overlap that
results in the lowest mismatch density (proportion of mismatched bases in
the overlapped region).  Ties between multiple overlaps are broken by
considering quality scores at mismatch sites.  When building the merged
sequence, FLASH computes a consensus sequence in the overlapped region.
More details can be found in the original publication
(http://bioinformatics.oxfordjournals.org/content/27/21/2957.full).

Limitations of FLASH include:
   - FLASH cannot merge paired-end reads that do not overlap.
   - FLASH is not designed for data that has a significant amount of indel
     errors (such as Sanger sequencing data).  It is best suited for Illumina
     data.

----------------------------------------------------------------------------
                               MANDATORY INPUT
----------------------------------------------------------------------------

The most common input to FLASH is two FASTQ files containing read 1 and read 2
of each mate pair, respectively, in the same order.

Alternatively, you may provide one FASTQ file, which may be standard input,
containing paired-end reads in either interleaved FASTQ (see the
--interleaved-input option) or tab-delimited (see the --tab-delimited-input
option) format.  In all cases, gzip compressed input is autodetected.  Also,
in all cases, the PHRED offset is, by default, assumed to be 33; use the
--phred-offset option to change it.

----------------------------------------------------------------------------
                                   OUTPUT
----------------------------------------------------------------------------

The default output of FLASH consists of the following files:

   - out.extendedFrags.fastq      The merged reads.
   - out.notCombined_1.fastq      Read 1 of mate pairs that were not merged.
   - out.notCombined_2.fastq      Read 2 of mate pairs that were not merged.
   - out.hist                     Numeric histogram of merged read lengths.
   - out.histogram                Visual histogram of merged read lengths.

FLASH also logs informational messages to standard output.  These can also be
redirected to a file, as in the following example:

  $ flash reads_1.fq reads_2.fq 2>&1 | tee flash.log

In addition, FLASH supports several features affecting the output:

   - Writing the merged reads directly to standard output (--to-stdout)
   - Writing gzip compressed output files (-z) or using an external
     compression program (--compress-prog)
   - Writing the uncombined read pairs in interleaved FASTQ format
     (--interleaved-output)
   - Writing all output reads to a single file in tab-delimited format
     (--tab-delimited-output)

----------------------------------------------------------------------------
                                   OPTIONS
----------------------------------------------------------------------------

  -m, --min-overlap=NUM   The minimum required overlap length between two
                          reads to provide a confident overlap.  Default:
                          10bp.

  -M, --max-overlap=NUM   Maximum overlap length expected in approximately
                          90% of read pairs.  It is by default set to 65bp,
                          which works well for 100bp reads generated from a
                          180bp library, assuming a normal distribution of
                          fragment lengths.  Overlaps longer than the maximum
                          overlap parameter are still considered as good
                          overlaps, but the mismatch density (explained below)
                          is calculated over the first max_overlap bases in
                          the overlapped region rather than the entire
                          overlap.  Default: 65bp, or calculated from the
                          specified read length, fragment length, and fragment
                          length standard deviation.

  -x, --max-mismatch-density=NUM
                          Maximum allowed ratio between the number of
                          mismatched base pairs and the overlap length.
                          Two reads will not be combined with a given overlap
                          if that overlap results in a mismatched base density
                          higher than this value.  Note: Any occurence of an
                          'N' in either read is ignored and not counted
                          towards the mismatches or overlap length.  Our
                          experimental results suggest that higher values of
                          the maximum mismatch density yield larger
                          numbers of correctly merged read pairs but at
                          the expense of higher numbers of incorrectly
                          merged read pairs.  Default: 0.25.

  -O, --allow-outies      Also try combining read pairs in the "outie"
                          orientation, e.g.

                               Read 1: <-----------
                               Read 2:       ------------>

                          as opposed to only the "innie" orientation, e.g.

                               Read 1:       <------------
                               Read 2: ----------->

                          FLASH uses the same parameters when trying each
                          orientation.  If a read pair can be combined in
                          both "innie" and "outie" orientations, the
                          better-fitting one will be chosen using the same
                          scoring algorithm that FLASH normally uses.

                          This option also causes extra .innie and .outie
                          histogram files to be produced.

  -p, --phred-offset=OFFSET
                          The smallest ASCII value of the characters used to
                          represent quality values of bases in FASTQ files.
                          It should be set to either 33, which corresponds
                          to the later Illumina platforms and Sanger
                          platforms, or 64, which corresponds to the
                          earlier Illumina platforms.  Default: 33.

  -r, --read-len=LEN
  -f, --fragment-len=LEN
  -s, --fragment-len-stddev=LEN
                          Average read length, fragment length, and fragment
                          standard deviation.  These are convenience parameters
                          only, as they are only used for calculating the
                          maximum overlap (--max-overlap) parameter.
                          The maximum overlap is calculated as the overlap of
                          average-length reads from an average-size fragment
                          plus 2.5 times the fragment length standard
                          deviation.  The default values are -r 100, -f 180,
                          and -s 18, so this works out to a maximum overlap of
                          65 bp.  If --max-overlap is specified, then the
                          specified value overrides the calculated value.

                          If you do not know the standard deviation of the
                          fragment library, you can probably assume that the
                          standard deviation is 10% of the average fragment
                          length.

  --cap-mismatch-quals    Cap quality scores assigned at mismatch locations
                          to 2.  This was the default behavior in FLASH v1.2.7
                          and earlier.  Later versions will instead calculate
                          such scores as max(|q1 - q2|, 2); that is, the
                          absolute value of the difference in quality scores,
                          but at least 2.  Essentially, the new behavior
                          prevents a low quality base call that is likely a
                          sequencing error from significantly bringing down
                          the quality of a high quality, likely correct base
                          call.

  --interleaved-input     Instead of requiring files MATES_1.FASTQ and
                          MATES_2.FASTQ, allow a single file MATES.FASTQ that
                          has the paired-end reads interleaved.  Specify "-"
                          to read from standard input.

  --interleaved-output    Write the uncombined pairs in interleaved FASTQ
                          format.

  -I, --interleaved       Equivalent to specifying both --interleaved-input
                          and --interleaved-output.

  -Ti, --tab-delimited-input
                          Assume the input is in tab-delimited format
                          rather than FASTQ, in the format described below in
                          '--tab-delimited-output'.  In this mode you should
                          provide a single input file, each line of which must
                          contain either a read pair (5 fields) or a single
                          read (3 fields).  FLASH will try to combine the read
                          pairs.  Single reads will be written to the output
                          file as-is if also using --tab-delimited-output;
                          otherwise they will be ignored.  Note that you may
                          specify "-" as the input file to read the
                          tab-delimited data from standard input.

  -To, --tab-delimited-output
                          Write output in tab-delimited format (not FASTQ).
                          Each line will contain either a combined pair in the
                          format 'tag <tab> seq <tab> qual' or an uncombined
                          pair in the format 'tag <tab> seq_1 <tab> qual_1
                          <tab> seq_2 <tab> qual_2'.

  -o, --output-prefix=PREFIX
                          Prefix of output files.  Default: "out".

  -d, --output-directory=DIR
                          Path to directory for output files.  Default:
                          current working directory.

  -c, --to-stdout         Write the combined reads to standard output.  In
                          this mode, with FASTQ output (the default) the
                          uncombined reads are discarded.  With tab-delimited
                          output, uncombined reads are included in the
                          tab-delimited data written to standard output.
                          In both cases, histogram files are not written,
                          and informational messages are sent to standard
                          error rather than to standard output.

  -z, --compress          Compress the output files directly with zlib,
                          using the gzip container format.  Similar to
                          specifying --compress-prog=gzip and --suffix=gz,
                          but may be slightly faster.

  --compress-prog=PROG    Pipe the output through the compression program
                          PROG, which will be called as `PROG -c -',
                          plus any arguments specified by --compress-prog-args.
                          PROG must read uncompressed data from standard input
                          and write compressed data to standard output when
                          invoked as noted above.
                          Examples: gzip, bzip2, xz, pigz.

  --compress-prog-args=ARGS
                          A string of additional arguments that will be passed
                          to the compression program if one is specified with
                          --compress-prog=PROG.  (The arguments '-c -' are
                          still passed in addition to explicitly specified
                          arguments.)

  --suffix=SUFFIX, --output-suffix=SUFFIX
                          Use SUFFIX as the suffix of the output files
                          after ".fastq".  A dot before the suffix is assumed,
                          unless an empty suffix is provided.  Default:
                          nothing; or 'gz' if -z is specified; or PROG if
                          --compress-prog=PROG is specified.

  -t, --threads=NTHREADS  Set the number of worker threads.  This is in
                          addition to the I/O threads.  Default: number of
                          processors.  Note: if you need FLASH's output to
                          appear deterministically or in the same order as
                          the original reads, you must specify -t 1
                          (--threads=1).

  -q, --quiet             Do not print informational messages.

  -h, --help              Display this help and exit.

  -v, --version           Display version.

Run `flash --help | less' to prevent this text from scrolling by.

flash2 --h の出力

Usage: flash [OPTIONS] MATES_1.FASTQ MATES_2.FASTQ
       flash [OPTIONS] --interleaved-input (MATES.FASTQ | -)
       flash [OPTIONS] --tab-delimited-input (MATES.TAB | -)

----------------------------------------------------------------------------
                                 DESCRIPTION                                
----------------------------------------------------------------------------

FLASH (Fast Length Adjustment of SHort reads) is an accurate and fast tool
to merge paired-end reads that were generated from DNA fragments whose
lengths are shorter than twice the length of reads.  Merged read pairs result
in unpaired longer reads, which are generally more desired in genome
assembly and genome analysis processes.

Briefly, the FLASH algorithm considers all possible overlaps at or above a
minimum length between the reads in a pair and chooses the overlap that
results in the lowest mismatch density (proportion of mismatched bases in
the overlapped region).  Ties between multiple overlaps are broken by
considering quality scores at mismatch sites.  When building the merged
sequence, FLASH computes a consensus sequence in the overlapped region.
More details can be found in the original publication
(http://bioinformatics.oxfordjournals.org/content/27/21/2957.full).

Limitations of FLASH include:
   - FLASH cannot merge paired-end reads that do not overlap.
   - FLASH is not designed for data that has a significant amount of indel
     errors (such as Sanger sequencing data).  It is best suited for Illumina
     data.

----------------------------------------------------------------------------
                               MANDATORY INPUT
----------------------------------------------------------------------------

The most common input to FLASH is two FASTQ files containing read 1 and read 2
of each mate pair, respectively, in the same order.

Alternatively, you may provide one FASTQ file, which may be standard input,
containing paired-end reads in either interleaved FASTQ (see the
--interleaved-input option) or tab-delimited (see the --tab-delimited-input
option) format.  In all cases, gzip compressed input is autodetected.  Also,
in all cases, the PHRED offset is, by default, assumed to be 33; use the
--phred-offset option to change it.

----------------------------------------------------------------------------
                                   OUTPUT
----------------------------------------------------------------------------

The default output of FLASH consists of the following files:

   - out.extendedFrags.fastq      The merged reads.
   - out.notCombined_1.fastq      Read 1 of mate pairs that were not merged.
   - out.notCombined_2.fastq      Read 2 of mate pairs that were not merged.
   - out.hist                     Numeric histogram of merged read lengths.
   - out.histogram                Visual histogram of merged read lengths.

FLASH also logs informational messages to standard output.  These can also be
redirected to a file, as in the following example:

  $ flash reads_1.fq reads_2.fq 2>&1 | tee flash.log

In addition, FLASH supports several features affecting the output:

   - Writing the merged reads directly to standard output (--to-stdout)
   - Writing gzip compressed output files (-z) or using an external
     compression program (--compress-prog)
   - Writing the uncombined read pairs in interleaved FASTQ format
     (--interleaved-output)
   - Writing all output reads to a single file in tab-delimited format
     (--tab-delimited-output)

----------------------------------------------------------------------------
                                   OPTIONS
----------------------------------------------------------------------------

  -Q, --quality-cutoff=NUM  The cut off number for the quality score
                          corresponding wtih the percent cutoff.  Default:
                          2.
  -C, --percent-cutoff=NUM   The cutoff percentage for each read that will
                          be discarded if it falls below -Q option. (0-100)  Default:
                          50.
  -D, --no-discard         This turns off the discard logic Default: false

  -m, --min-overlap=NUM   The minimum required overlap length between two
                          reads to provide a confident overlap. Default 10bp.

  -M, --max-overlap=NUM   Maximum overlap length expected in approximately
                          90% of read pairs.  It is by default set to 65bp,
                          which works well for 100bp reads generated from a
                          180bp library, assuming a normal distribution of
                          fragment lengths.  Overlaps longer than the maximum
                          overlap parameter are still considered as good
                          overlaps, but the mismatch density (explained below)
                          is calculated over the first max_overlap bases in
                          the overlapped region rather than the entire
                          overlap.  Default: 65bp, or calculated from the
                          specified read length, fragment length, and fragment
                          length standard deviation.

  -e, --min-overlap-outie=NUM   The minimum required overlap length between two
                          reads to provide a confident overlap in an outie scenario.
                          Default: 35bp.

  -x, --max-mismatch-density=NUM
                          Maximum allowed ratio between the number of
                          mismatched base pairs and the overlap length.
                          Two reads will not be combined with a given overlap
                          if that overlap results in a mismatched base density
                          higher than this value.  Note: Any occurence of an
                          'N' in either read is ignored and not counted
                          towards the mismatches or overlap length.  Our
                          experimental results suggest that higher values of
                          the maximum mismatch density yield larger
                          numbers of correctly merged read pairs but at
                          the expense of higher numbers of incorrectly
                          merged read pairs.  Default: 0.25.

  -O, --allow-outies      Also try combining read pairs in the "outie"
                          orientation, e.g.

                               Read 1: <-----------
                               Read 2:       ------------>

                          as opposed to only the "innie" orientation, e.g.

                               Read 1:       <------------
                               Read 2: ----------->

                          FLASH uses the same parameters when trying each
                          orientation.  If a read pair can be combined in
                          both "innie" and "outie" orientations, the
                          better-fitting one will be chosen using the same
                          scoring algorithm that FLASH normally uses.

                          This option also causes extra .innie and .outie
                          histogram files to be produced.

  -p, --phred-offset=OFFSET
                          The smallest ASCII value of the characters used to
                          represent quality values of bases in FASTQ files.
                          It should be set to either 33, which corresponds
                          to the later Illumina platforms and Sanger
                          platforms, or 64, which corresponds to the
                          earlier Illumina platforms.  Default: 33.

  -r, --read-len=LEN
  -f, --fragment-len=LEN
  -s, --fragment-len-stddev=LEN
                          Average read length, fragment length, and fragment
                          standard deviation.  These are convenience parameters
                          only, as they are only used for calculating the
                          maximum overlap (--max-overlap) parameter.
                          The maximum overlap is calculated as the overlap of
                          average-length reads from an average-size fragment
                          plus 2.5 times the fragment length standard
                          deviation.  The default values are -r 100, -f 180,
                          and -s 18, so this works out to a maximum overlap of
                          65 bp.  If --max-overlap is specified, then the
                          specified value overrides the calculated value.

                          If you do not know the standard deviation of the
                          fragment library, you can probably assume that the
                          standard deviation is 10% of the average fragment
                          length.

  --cap-mismatch-quals    Cap quality scores assigned at mismatch locations
                          to 2.  This was the default behavior in FLASH v1.2.7
                          and earlier.  Later versions will instead calculate
                          such scores as max(|q1 - q2|, 2); that is, the
                          absolute value of the difference in quality scores,
                          but at least 2.  Essentially, the new behavior
                          prevents a low quality base call that is likely a
                          sequencing error from significantly bringing down
                          the quality of a high quality, likely correct base
                          call.

  --interleaved-input     Instead of requiring files MATES_1.FASTQ and
                          MATES_2.FASTQ, allow a single file MATES.FASTQ that
                          has the paired-end reads interleaved.  Specify "-"
                          to read from standard input.

  --interleaved-output    Write the uncombined pairs in interleaved FASTQ
                          format.

  -I, --interleaved       Equivalent to specifying both --interleaved-input
                          and --interleaved-output.

  -Ti, --tab-delimited-input
                          Assume the input is in tab-delimited format
                          rather than FASTQ, in the format described below in
                          '--tab-delimited-output'.  In this mode you should
                          provide a single input file, each line of which must
                          contain either a read pair (5 fields) or a single
                          read (3 fields).  FLASH will try to combine the read
                          pairs.  Single reads will be written to the output
                          file as-is if also using --tab-delimited-output;
                          otherwise they will be ignored.  Note that you may
                          specify "-" as the input file to read the
                          tab-delimited data from standard input.

  -To, --tab-delimited-output
                          Write output in tab-delimited format (not FASTQ).
                          Each line will contain either a combined pair in the
                          format 'tag <tab> seq <tab> qual' or an uncombined
                          pair in the format 'tag <tab> seq_1 <tab> qual_1
                          <tab> seq_2 <tab> qual_2'.

  -o, --output-prefix=PREFIX
                          Prefix of output files.  Default: "out".

  -d, --output-directory=DIR
                          Path to directory for output files.  Default:
                          current working directory.

  -c, --to-stdout         Write the combined reads to standard output.  In
                          this mode, with FASTQ output (the default) the
                          uncombined reads are discarded.  With tab-delimited
                          output, uncombined reads are included in the
                          tab-delimited data written to standard output.
                          In both cases, histogram files are not written,
                          and informational messages are sent to standard
                          error rather than to standard output.

  -z, --compress          Compress the output files directly with zlib,
                          using the gzip container format.  Similar to
                          specifying --compress-prog=gzip and --suffix=gz,
                          but may be slightly faster.

  --compress-prog=PROG    Pipe the output through the compression program
                          PROG, which will be called as `PROG -c -',
                          plus any arguments specified by --compress-prog-args.
                          PROG must read uncompressed data from standard input
                          and write compressed data to standard output when
                          invoked as noted above.
                          Examples: gzip, bzip2, xz, pigz.

  --compress-prog-args=ARGS
                          A string of additional arguments that will be passed
                          to the compression program if one is specified with
                          --compress-prog=PROG.  (The arguments '-c -' are
                          still passed in addition to explicitly specified
                          arguments.)

  --suffix=SUFFIX, --output-suffix=SUFFIX
                          Use SUFFIX as the suffix of the output files
                          after ".fastq".  A dot before the suffix is assumed,
                          unless an empty suffix is provided.  Default:
                          nothing; or 'gz' if -z is specified; or PROG if
                          --compress-prog=PROG is specified.

  -t, --threads=NTHREADS  Set the number of worker threads.  This is in
                          addition to the I/O threads.  Default: number of
                          processors.  Note: if you need FLASH's output to
                          appear deterministically or in the same order as
                          the original reads, you must specify -t 1
                          (--threads=1).

  -q, --quiet             Do not print informational messages.

  -h, --help              Display this help and exit.

  -v, --version           Display version.

Run `flash2 --help | less' to prevent this text from scrolling by.

R言語でのデンドログラム(樹形図)と階層的クラスタリングの諸事【hclustとheatmap.2での階層的クラスタリング】

はじめに

階層的クラスタリングは、以前からまとめてみたかった話です。 グルグル廻って、ようやく、ここまで辿り着いた感じです。

この記事では、R言語での階層的クラスタリングの基本ということで、 主に、hclustとheatmap.2という、2つの関数を扱います。 けど、関数群をまとめていると、他のパッケージとかも色々と盛り沢山になってしまった。。。

まず、hclust関数は、statsパッケージ内の関数の1つで、 『非類似度の集合に関する階層的クラスター分析とその分析方法』を提供する、 R業界で最も有名な、階層的クラスタリング関数の1つです。

www.rdocumentation.org

他方、gplotsパッケージが提供する heatmap.2関数は、 従来の階層的クラスター分析に加えて、 ヒートマップや密度データなどの付加情報も一緒に描ける便利な関数となっています。

www.rdocumentation.org

今回、ペンギンさんのデータを対象に、階層的クラスタリングをやってみることにします。

パーマー群島(南極大陸)のペンギンさんのデータを活用する 

ペンギンさんのデータは、 palmerpenguinsパッケージで提供されている、 パーマーペンギンズ(palmerpenguins)のデータのことである*1

allisonhorst.github.io

このデータセットでは、 「南極のパーマー基地周辺のパーマー群島の島々で観察された アデリー、ヒゲペンギン、ジェンツーペンギンの成鳥のサイズ測定、クラッチ観察、 および血液同位体比のデータが掲載されている。 このデータは、Dr. Kristen Gorman氏とthe Palmer Station Long Term Ecological Research (LTER) Programによって収集され利用可能」となっています。

このデータそのままだと欠損値があるので、 まずは、それらを除去する作業とかをします。

#ペンギンさんのデータのロード
install.packages("palmerpenguins")
library(palmerpenguins)

#ヘッダー表示
head(penguins)
# A tibble: 6 × 8
#  species island    bill_length_mm bill_depth_mm
#  <fct>   <fct>              <dbl>         <dbl>
#1 Adelie  Torgersen           39.1          18.7
#2 Adelie  Torgersen           39.5          17.4
#3 Adelie  Torgersen           40.3          18  
#4 Adelie  Torgersen           NA            NA  
#5 Adelie  Torgersen           36.7          19.3
#6 Adelie  Torgersen           39.3          20.6
# … with 4 more variables: flipper_length_mm <int>,
#   body_mass_g <int>, sex <fct>, year <int>

#データフレームに変換
penguinsDF <- data.frame(penguins)

#欠損数のカウント
sum(is.na(penguinsDF))
#[1] 19

#欠損を除く
penguinsDF01 <- na.omit(penguinsDF[,c("species", "island", 
                                      "bill_length_mm", "bill_depth_mm",
                                      "flipper_length_mm", "body_mass_g")])
#欠損数のカウント
sum(is.na(penguinsDF01))
#[1] 0

#speciesisland列の追加: species + island + 通し番号
penguinsDF01$species.island <- paste(penguinsDF01$species, penguinsDF01$island, 1:nrow(penguinsDF01))
penguinsDF02 <- penguinsDF01[,-c(1:2)]

#最終的なデータセット
head(penguinsDF02)
#  bill_length_mm bill_depth_mm flipper_length_mm body_mass_g     species.island
#1           39.1          18.7               181        3750 Adelie Torgersen 1
#2           39.5          17.4               186        3800 Adelie Torgersen 2
#3           40.3          18.0               195        3250 Adelie Torgersen 3
#5           36.7          19.3               193        3450 Adelie Torgersen 4
#6           39.3          20.6               190        3650 Adelie Torgersen 5
#7           38.9          17.8               181        3625 Adelie Torgersen 6

データとしては、欠損値(NA)を除いて、 "bill_length_mm"、"bill_depth_mm"、 "flipper_length_mm"、"body_mass_g"カラムのデータを使用しています。

hclust関数での階層的クラスタリング

「penguinsDF02」のデータフレームを加工して、数値データのみにします。 次に、scale関数で、ScalingとCentering補正する場合としない場合とで、 データフレームの作成を行なっています。

#データの加工 (数値データのみ)
Column <- c("bill_length_mm", "bill_depth_mm", "flipper_length_mm", "body_mass_g")

#補正無しの場合
penguinsDF03 <- penguinsDF02[,Column]

#ScalingとCentering補正の場合
penguinsDF04 <- scale(penguinsDF03)

head(penguinsDF04)
#  bill_length_mm bill_depth_mm flipper_length_mm body_mass_g
#1     -0.8832047     0.7843001        -1.4162715  -0.5633167
#2     -0.8099390     0.1260033        -1.0606961  -0.5009690
#3     -0.6634077     0.4298326        -0.4206603  -1.1867934
#5     -1.3227986     1.0881294        -0.5628905  -0.9374027
#6     -0.8465718     1.7464261        -0.7762357  -0.6880121
#7     -0.9198375     0.3285561        -1.4162715  -0.7191859

これらのデータセットを使用して、 次に、hclustのagglomeration methodをいろいろと試してみました。 距離計算には、ユークリッド距離(Euclidean distance)を使っています。

ウォード法(ward.D)を使用する場合

補正有りのpenguinsDF04で、階層的クラスタリングをやってみました。

#"ward.D" method
Xd <- dist(penguinsDF04, method="euclidean")
h <- hclust(Xd, method = "ward.D")

#図示
par(family="HiraKakuProN-W3", mgp=c(2.5, 1, 0), xpd=T,
    mar=c(2, 5, 5, 1))
plot(h, hang=-1, cex=0.1, xlab = "", sub = "")

ちなみに、補正無しのpenguinsDF03でやって見ると。

#"ward.D" method
Xd <- dist(penguinsDF03, method="euclidean")
h <- hclust(Xd, method = "ward.D")

#図示
par(family="HiraKakuProN-W3", mgp=c(2.5, 1, 0), xpd=T,
    mar=c(2, 5, 5, 1))
plot(h, hang=-1, cex=0.1, xlab = "", sub = "")

この場合、補正無しなので、縦軸の高さがかなり大きくなります。

"ward.D" method + データフレームの転置

データの方向を変えてクラスタリングもできますが、 4変数を見るだけだと、あまり面白みはないかも。 t関数で、行列・データフレームの転置ができます。

#"ward.D" method + データフレームの転置
Xd <- dist(t(penguinsDF04), method="euclidean")
h <- hclust(Xd, method = "ward.D")

#図示
par(family="HiraKakuProN-W3", mgp=c(2.5, 1, 0), xpd=T,
    mar=c(1, 5, 5, 1))
plot(h, hang=-1, cex=0.5, xlab = "", sub = "")

ウォードD2法(ward.D2)を使用する場合

#"ward.D2" method
Xd <- dist(penguinsDF04, method="euclidean")
h <- hclust(Xd, method = "ward.D2")

#Or Xd^2も同じ結果
#h <- hclust(Xd^2, method="ward.D")

#図示
par(family="HiraKakuProN-W3", mgp=c(2.5, 1, 0), xpd=T,
    mar=c(2, 5, 5, 1))
plot(h, hang=-1, cex=0.1, xlab = "", sub = "")

私個人的には、デンドログラムのリーフの方の感じとしてはこれ形状が好きな感じです。

最近隣法(single)を使用する場合

#"single" method
Xd <- dist(penguinsDF04, method="euclidean")
h <- hclust(Xd, method = "single")

#図示
par(family="HiraKakuProN-W3", mgp=c(2.5, 1, 0), xpd=T,
    mar=c(2, 5, 5, 1))
plot(h, hang=-1, cex=0.1, xlab = "", sub = "")

群平均法(average)を使用する場合

#"average" method
Xd <- dist(penguinsDF04, method="euclidean")
h <- hclust(Xd, method = "average")

#図示
par(family="HiraKakuProN-W3", mgp=c(2.5, 1, 0), xpd=T,
    mar=c(2, 5, 5, 1))
plot(h, hang=-1, cex=0.1, xlab = "", sub = "")


McQuitty法(mcquitty)を使用する場合

#"mcquitty" method
Xd <- dist(penguinsDF04, method="euclidean")
h <- hclust(Xd, method = "mcquitty")

#図示
par(family="HiraKakuProN-W3", mgp=c(2.5, 1, 0), xpd=T,
    mar=c(2, 5, 5, 1))
plot(h, hang=-1, cex=0.1, xlab = "", sub = "")

メディアン法(median)を使用する場合

#"median" method
Xd <- dist(penguinsDF04, method="euclidean")
h <- hclust(Xd, method = "median")

#図示
par(family="HiraKakuProN-W3", mgp=c(2.5, 1, 0), xpd=T,
    mar=c(2, 5, 5, 1))
plot(h, hang=-1, cex=0.1, xlab = "", sub = "")


重心法(centroid)を使用する場合

#"centroid" method
Xd <- dist(penguinsDF04, method="euclidean")
h <- hclust(Xd, method = "centroid")

#図示
par(family="HiraKakuProN-W3", mgp=c(2.5, 1, 0), xpd=T,
    mar=c(2, 5, 5, 1))
plot(h, hang=-1, cex=0.1, xlab = "", sub = "")


私にとっては、"ward.D2" methodがデンドログラムに馴染みがあって、見易い気がします。

という事で、"ward.D2" methodに絞って、他の距離計算法についても試してみることにします。

相関関係に基づく距離計算と階層的クラスタリング

相関関係を使って距離計算を行い、階層的クラスタリングを行う場合を紹介します。

一般的に、相関係数は、「1」に近いほど相関が強い、つまりは『似ている』ことを示します。 他方、「0」に近いほど、「相関が弱い・相関関係が無い」ことを示します。

距離の計算上は、似ていない場合にお互いの距離が離れててほしいため、 『1 - 相関係数』を距離として定義することになります。 この距離関係では、『0』に近いほど、「似ている」ことを表せます。

スピアマン(Spearman)の順位相関係数と階層的クラスタリング

ここでは、『1 - (Spearmanの順位相関係数)』の関係を使って、 距離行列を作成して、階層的クラスタリングをやってみます。 また、これまでのdist()ではなく、代わりに、 as.dist()を使用するのがポイントとなります。

##1 - (Spearmanの順位相関係数)での距離行列
Xd <- as.dist(1 - cor(t(penguinsDF04), method = "spearman"))
h <- hclust(Xd, method = "ward.D2")

#図示
par(family="HiraKakuProN-W3", mgp=c(2.5, 1, 0), xpd=T,
    mar=c(2, 5, 5, 1))
plot(h, hang=-1, cex=0.1, xlab = "", sub = "")


(補足として)

dist関数は実際に距離行列を計算するのに対して、 as.dist関数はオブジェクトを距離行列に強制的に変換するのみとのことです。 良く解らんけど・・・

stackoverflow.com

https://lecture.ecc.u-tokyo.ac.jp/~aiwata/biostat_basic/2013/text4lec4_2.pdf

コサイン距離と階層的クラスタリング

コサイン距離(コサイン類似度)を使ったケースも紹介します。

コサイン類似度とは、内積空間の2つのベクトル間の類似度を表す尺度となります。

atmarkit.itmedia.co.jp

R内でのパッケージとしては、 LSA (Latent Semantic Analysis)パッケージのcosine()関数を使います。

www.statology.org

#lsaパッケージのインストール
install.packages("lsa")
library(lsa)

##1 - コサイン類似度での距離行列
Xd <- as.dist(1 - cosine(t(penguinsDF04)))
h <- hclust(Xd, method = "ward.D2")

#図示
par(family="HiraKakuProN-W3", mgp=c(2.5, 1, 0), xpd=T,
    mar=c(2, 5, 5, 1))
plot(h, hang=-1, cex=0.1, xlab = "", sub = "")


ペンギンさんのデータでは、Spearman使うよりも、 コサイン距離の方が、階層クラスタリングとしてはキレイに見えますね。

混合データのときの距離行列計算と階層的クラスタリング

cluster::daisy()を使用すると、 混合データ(数字以外の文字列のデータにも使える)でも 距離行列が計算できるようになります。 なんだか、便利そうな響きがします。

ここでは、文字列(Factorとなっているが)のデータが含まれている、 penguinsDF01のデータセットを使用します。

#clusterパッケージのインストール
install.packages("cluster")
library(cluster)

#ディメンジョン表示
dim(penguinsDF01)
#[1] 342   9

#詳細表示
str(penguinsDF01[,c(1:6)])
#'data.frame': 342 obs. of  6 variables:
# $ species          : Factor w/ 3 levels "Adelie","Chinstrap",..: 1 1 1 1 1 1 1 1 1 1 ...
# $ island           : Factor w/ 3 levels "Biscoe","Dream",..: 3 3 3 3 3 3 3 3 3 3 ...
# $ bill_length_mm   : num  39.1 39.5 40.3 36.7 39.3 38.9 39.2 34.1 42 37.8 ...
# $ bill_depth_mm    : num  18.7 17.4 18 19.3 20.6 17.8 19.6 18.1 20.2 17.1 ...
# $ flipper_length_mm: int  181 186 195 193 190 181 195 193 190 186 ...
# $ body_mass_g      : int  3750 3800 3250 3450 3650 3625 4675 3475 4250 3300 ...

#非類似度マトリクス計算
Xd <- cluster::daisy(penguinsDF01[,c(1:6)], metric="gower")

str(Xd)
#num [1:342, 1:342] 0 0.0447 0.0839 0.0742 0.069 ...
# - attr(*, "dimnames")=List of 2
#  ..$ : chr [1:342] "1" "2" "3" "5" ...

#クラスタリング
h <- hclust(Xd, method = "ward.D2")

#図示
par(family="HiraKakuProN-W3", mgp=c(2.5, 1, 0), xpd=T,
    mar=c(2, 5, 5, 1))
plot(h, hang=-1, cex=0.1, xlab = "", sub = "")

factoextra::get_dist()関数を使った相関計算と階層的クラスタリング

次に、factoextraパッケージのget_dist()関数を使った方法を紹介します。 get_dist()関数では、データ行列において行方向の距離行列を計算します。

先述した、cor関数使用の場合だとR上で計算式を組む必要がありますが、 factoextraパッケージのget_dist()関数では、 標準でよく使われる、dist()関数では扱われていない、相関に基づく距離尺度をサポートしています。 そのため、methodとして、ピアソン(pearson)、スピアマン(spearman),ケンドール(kendall)の相関係数を選択できます。

search.r-project.org

#factoextraのインストール
install.packages("factoextra")
library(factoextra)

##ピアソン相関での距離行列
Xd <- factoextra::get_dist(x = penguinsDF04, method = "pearson")
h <- hclust(Xd, method = "ward.D2")

#図示
par(family="HiraKakuProN-W3", mgp=c(2.5, 1, 0), xpd=T,
    mar=c(2, 5, 5, 1))
plot(h, hang=-1, cex=0.1, xlab = "", sub = "")

一応、『get_dist()とas.dist(1 - cor)の結果は同じか?』を検証してみました。

#pearson法で計算した場合
Xd1 <- factoextra::get_dist(x = penguinsDF04, method = "pearson")
Xd2 <- as.dist(1 - cor(t(penguinsDF04), method = "pearson"))

#差分計算
sum(Xd1 - Xd2)
#[1] 0

#spearman法で計算した場合
Xd1 <- factoextra::get_dist(x = penguinsDF04, method = "spearman")
Xd2 <- as.dist(1 - cor(t(penguinsDF04), method = "spearman"))

#差分計算
sum(Xd1 - Xd2)
#[1] 0

その結果、pearsonでもspearmanでも差分は「0」で同じ距離行列を返すことが分かりました。

階層的クラスタリングの結果をcutree関数やrect.hclust関数でグルーピングする

cutree関数やrect.hclust関数を使うと、 hclustで得られた階層的クラスタリングの樹木図を 希望するグループ数または高さ(距離)を指定して いくつかのグループに分割することができます。

#"ward.D2" method
Xd <- dist(penguinsDF04, method="euclidean")
h <- hclust(Xd, method = "ward.D2")

#図示
par(family="HiraKakuProN-W3", mgp=c(2.5, 1, 0), xpd=T,
    mar=c(2, 5, 5, 1))
plot(h, hang=-1, cex=0.1, xlab = "", sub = "")

#3グループに分割する
hcut <- cutree(h, k = 3) 

#テーブル表示
table(hcut)
#hcut
#  1   2   3 
#162 123  57 

#クラスターを3つの四角で囲む 
rect.hclust(h , k = 3, border = 2:4) 

#高さhで切って、whichは番号(ツリーの左から右へ)でクラスタを選択する
#デフォルトは which = 1:k です。
rect.hclust(h, h = 5, which = 7, border = "blue")

pvclustによるマルチスケールブートストラップと階層的クラスタリング

pvclustパッケージは、 階層型クラスター分析における不確実性を評価するためのパッケージです。

階層型クラスタリングの各クラスタについて、 マルチスケールブートストラップリサンプリングにより AU (Approximately Unbiased p-value) や BP (Bootstrap Probability)といった統計量をを算出できます。 クラスターのP値は、0 から 1 の間の値を示し、 そのクラスタがデータによってどの程度強く支持されるかを示します。

github.com

#pvclustパッケージのインストール
install.packages("pvclust")
library(pvclust)

#マルチスケールブートストラップリサンプリング(non-parallel)
Xd.pv <- pvclust(penguinsDF04, nboot=100, parallel=FALSE)

#図示
plot(Xd.pv, cex.pv = 0.5, cex = 0.5, print.pv = c("au", "si", "bp"), hang=-1)
pvrect(Xd.pv, pv="au") 

図内で、 auは、近似不バイアスp値(the approximately unbiased p-value)、 siは、選択的推論のための近似不バイアスp値(apporximately unbiased p-values for selective inference)、 bpは、ブーストラップ確率(boostrap probability)を示します。

t(penguinsDF04)として、行と列を反転させて計算することもできて、 そうすると、変数が多くなってデンドログラムの解析っぽくなります。

heatmap.2による、階層的クラスタリングとヒートマップ

最後に、gplotsパッケージ内のheatmap.2関数を使用して、 拡張ヒートマップによる可視化をやってみます。 各種の引数は、以前に最適化したパラメータで行なっています。

#gplotsパッケージのインストール
install.packages("gplots")
library(gplots)

#作図の設定
par(family="HiraKakuProN-W3", mgp=c(3, 1, 0), xpd=T)

#5つのグループを事前に計算しておく
Xd <- dist(penguinsDF04, method="euclidean")
mat.c <- cutree(hclust(Xd, method = "ward.D2"), k=5)
clust.col <- c("black", "red", "blue", "green", "yellow")

#ヒートマップ実行
heatmap.2(penguinsDF04,
          col = colorpanel(100,"blue","white","red"),
          na.color="grey40",
          distfun = function(x) {dist(x, method="euclidean")}, 
          hclustfun = function(x) {hclust(x, method="ward.D2")},
          cexRow = 0.3, cexCol = 0.5,
          trace="none", symkey=FALSE, 
          dendrogram = "both", 
          Rowv = T, Colv = T,
          scale = "non",
          na.rm=T,
          RowSideColors=clust.col[mat.c],
          keysize = 0.7,
          densadj = 0.25, 
          main="Enhanced Heat Map",
          key.par = list(cex=0.3, mar=c(4,4,3.5,0), mgp=c(2.5, 1, 0)),
          sepcolor="grey40",sepwidth=c(0.1,0.1),
          offsetRow = 0.5, offsetCol = 0.25,
          adjRow = c(0,0.25), adjCol = c(NA,0.25))


まとめ

階層的クラスタリングについて、色々とまとめてみました。

データ解析のチュートリアルとして使える機会があれば幸いです。

また、次回のクラスタリングの企画では、 dendextendやfactoextraパッケージを使った事例を紹介したいと思っています。

関連資料

delta0726.web.fc2.com

rpubs.com

qiita.com

www.datanovia.com

https://www.ic.nanzan-u.ac.jp/~urakami/pdf/19Rpdf/19m_23.pdf

*1:先日のTokyo.Rで見かけたので、このデータを使いたくなった