
はじめに
knitrパッケージは、R言語による動的レポート生成のための汎用パッケージであって、Literate Programmingの手法を用いたRでの動的なレポート生成のための汎用ツールを提供しています。 また、mmtable2パッケージでは、ggplot2/patchwork 構文でテーブルを作成・結合することができます。 また、getting started vignetteで、簡単な紹介を参照してください。
Rでの気の利いたテーブル表示について、knitr & mmtable2の実行例をまとめてみた。
パッケージのインストール
#パッケージのインストール
install.packages("devtools")
devtools::install_github("ianmoran11/mmtable2")
install.packages("knitr")
install.packages("magrittr")
install.packages("tidyverse")

library(tidyverse)
library(mmtable2)
library(knitr)
library(magrittr)
library(gt)
knitr::kableを用いた実行例
#データのインポート
data(iris)

#headでの通常出力
head(iris)
#  Sepal.Length Sepal.Width Petal.Length Petal.Width Species
#1          5.1         3.5          1.4         0.2  setosa
#2          4.9         3.0          1.4         0.2  setosa
#3          4.7         3.2          1.3         0.2  setosa
#4          4.6         3.1          1.5         0.2  setosa
#5          5.0         3.6          1.4         0.2  setosa
#6          5.4         3.9          1.7         0.4  setosa

#pipeでの出力
iris %>%
  head() %>%
  knitr::kable(format = "pipe", booktabs = T)
#| Sepal.Length| Sepal.Width| Petal.Length| Petal.Width|Species |
#|------------:|-----------:|------------:|-----------:|:-------|
#|          5.1|         3.5|          1.4|         0.2|setosa  |
#|          4.9|         3.0|          1.4|         0.2|setosa  |
#|          4.7|         3.2|          1.3|         0.2|setosa  |
#|          4.6|         3.1|          1.5|         0.2|setosa  |
#|          5.0|         3.6|          1.4|         0.2|setosa  |
#|          5.4|         3.9|          1.7|         0.4|setosa  |

#rstでの出力
iris %>%
  head() %>%
  knitr::kable(format = "rst", booktabs = T)
#============  ===========  ============  ===========  =======
#Sepal.Length  Sepal.Width  Petal.Length  Petal.Width  Species
#============  ===========  ============  ===========  =======
#         5.1          3.5           1.4          0.2  setosa
#         4.9          3.0           1.4          0.2  setosa
#         4.7          3.2           1.3          0.2  setosa
#         4.6          3.1           1.5          0.2  setosa
#         5.0          3.6           1.4          0.2  setosa
#         5.4          3.9           1.7          0.4  setosa
#============  ===========  ============  ===========  =======

#simpleでの出力
iris %>%
  head() %>%
  knitr::kable(format = "simple")
# Sepal.Length   Sepal.Width   Petal.Length   Petal.Width  Species
#-------------  ------------  -------------  ------------  --------
#          5.1           3.5            1.4           0.2  setosa
#          4.9           3.0            1.4           0.2  setosa
#          4.7           3.2            1.3           0.2  setosa
#          4.6           3.1            1.5           0.2  setosa
#          5.0           3.6            1.4           0.2  setosa
#          5.4           3.9            1.7           0.4  setosa

#simple出力でオプション設定01
iris %>%
  head() %>%
  knitr::kable(format = "simple", booktabs = F, align = "c")
# Sepal.Length    Sepal.Width    Petal.Length    Petal.Width    Species
#--------------  -------------  --------------  -------------  ---------
#     5.1             3.5            1.4             0.2        setosa
#     4.9             3.0            1.4             0.2        setosa
#     4.7             3.2            1.3             0.2        setosa
#     4.6             3.1            1.5             0.2        setosa
#     5.0             3.6            1.4             0.2        setosa
#     5.4             3.9            1.7             0.4        setosa

#simple出力でオプション設定02
iris %>%
  head() %>%
  knitr::kable(format = "simple", booktabs = F, align = "r", padding = 2, caption = "iris")
#Table: iris
#  Sepal.Length    Sepal.Width    Petal.Length    Petal.Width    Species
#--------------  -------------  --------------  -------------  ---------
#           5.1            3.5             1.4            0.2     setosa
#           4.9            3.0             1.4            0.2     setosa
#           4.7            3.2             1.3            0.2     setosa
#           4.6            3.1             1.5            0.2     setosa
#           5.0            3.6             1.4            0.2     setosa
#           5.4            3.9             1.7            0.4     setosa

#latexでの出力
iris %>%
  head() %>%
  knitr::kable(format = "latex", booktabs = T)
#\begin{tabular}{rrrrl}
#\toprule
#Sepal.Length & Sepal.Width & Petal.Length & Petal.Width & Species\\
#\midrule
#5.1 & 3.5 & 1.4 & 0.2 & setosa\\
#4.9 & 3.0 & 1.4 & 0.2 & setosa\\
#4.7 & 3.2 & 1.3 & 0.2 & setosa\\
#4.6 & 3.1 & 1.5 & 0.2 & setosa\\
#5.0 & 3.6 & 1.4 & 0.2 & setosa\\
#\addlinespace
#5.4 & 3.9 & 1.7 & 0.4 & setosa\\
#\bottomrule
#\end{tabular}
mmtable2を用いた実行例
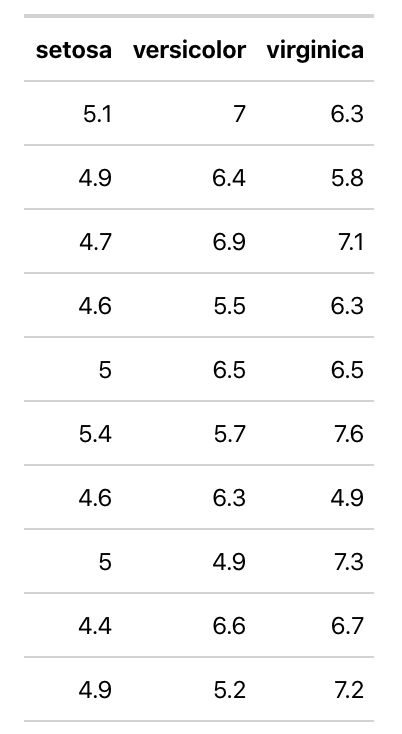
head(iris)
iris %>%
  mmtable(table_data = Sepal.Length) +
  header_top(Species)
#データ準備
gm_df <- gapminder_mm %>% filter(var != "Life expectancy")

head(gm_df)
# A tibble: 6 x 5
#  country   continent  year var        value
#  <chr>     <fct>     <int> <chr>      <chr>
#1 Australia Oceania    1992 Population 17.5
#2 Australia Oceania    1997 Population 18.6
#3 Australia Oceania    2002 Population 19.5
#4 Australia Oceania    2007 Population 20.4
#5 Botswana  Africa     1992 Population 1.3
#6 Botswana  Africa     1997 Population 1.5

table_gm <- gm_df %>% mmtable(table_data = value) +
  header_top(year) +
  header_top_left(var) +
  header_left(country) +
  header_left_top(continent)

table_gm
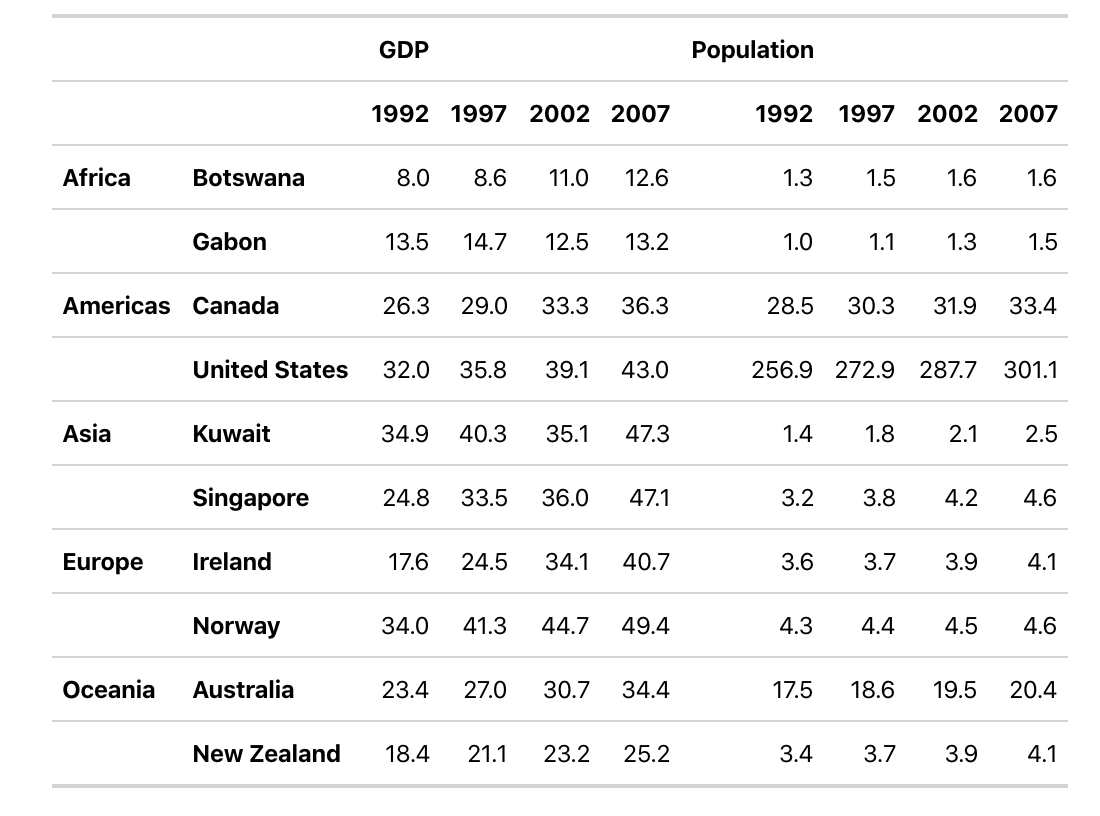
#Lineの設定
row_list <- cells_body(rows = c(1,3,5,7,9,11))
style_list <- list(cell_borders(sides = "top", color = "grey"))
table_gm + table_format( locations = row_list, style = style_list)

参考資料
https://githubmemory.com/repo/ianmoran11/mmtable2githubmemory.com